Guide · Portfolio
Allocation, performance, heat map and income
Look through your funds to what they hold, compare your record with two benchmarks, and see dividends and moves at a glance.
The Portfolio page has a tab for each view of your holdings: Holdings, Allocation, Performance, Theses, Waves, Heat map, Income and Import.
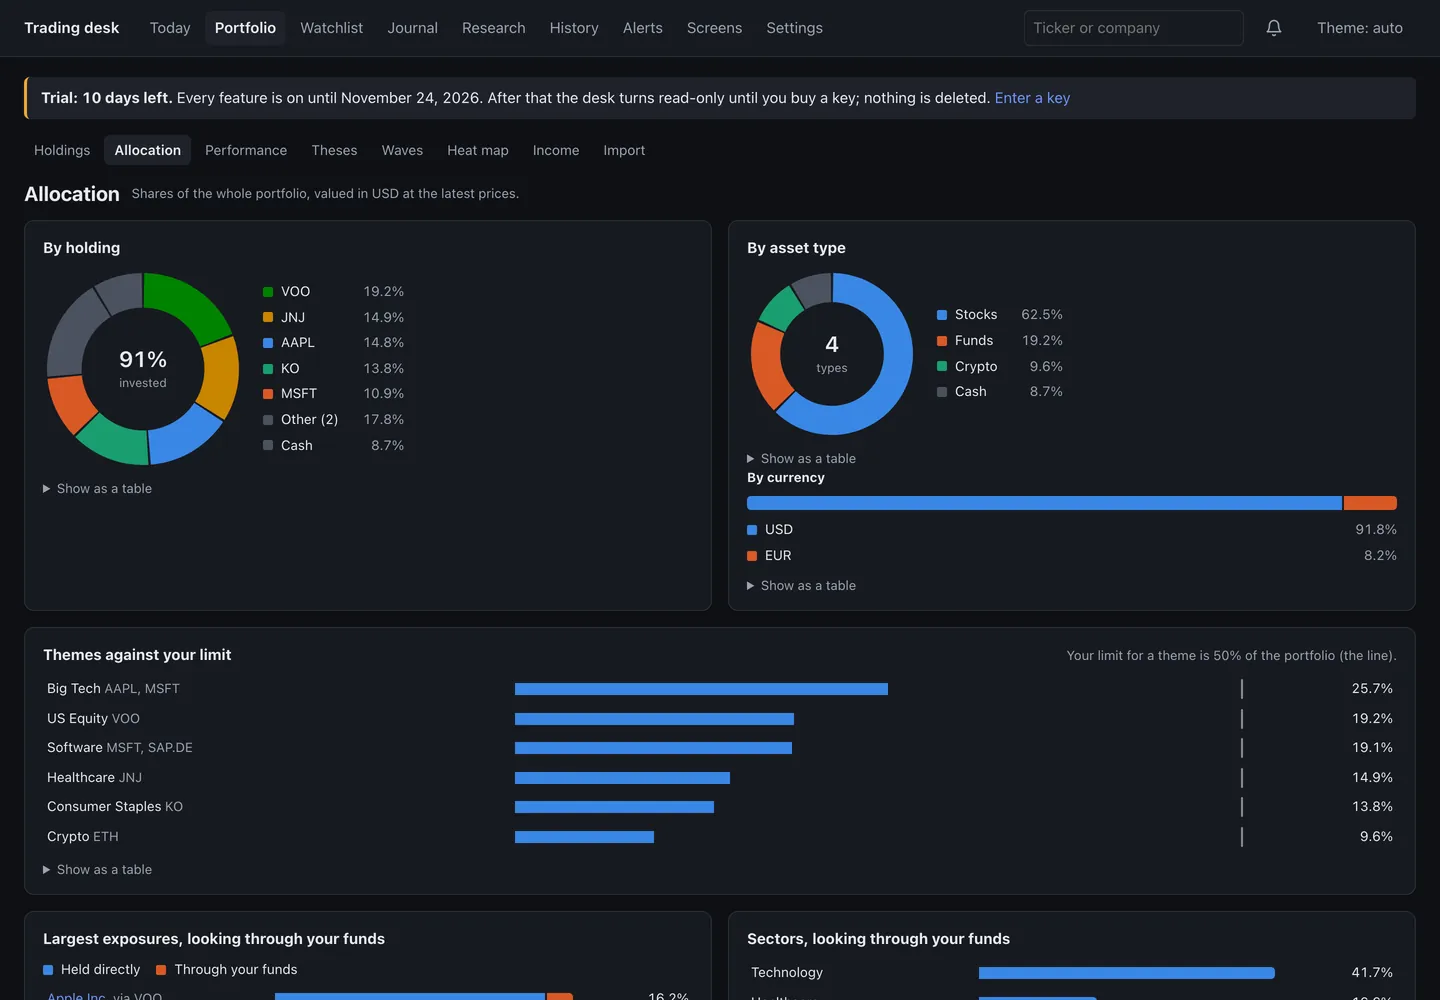
Allocation, looking through your funds
Allocation shows your portfolio by holding, by asset type, by currency and by theme, with each theme against your limit. For funds it goes one step further: it looks through each fund's ten largest holdings (Yahoo's list), so Largest exposures and Sectors show what you hold directly and through your funds together.
Performance against two benchmarks
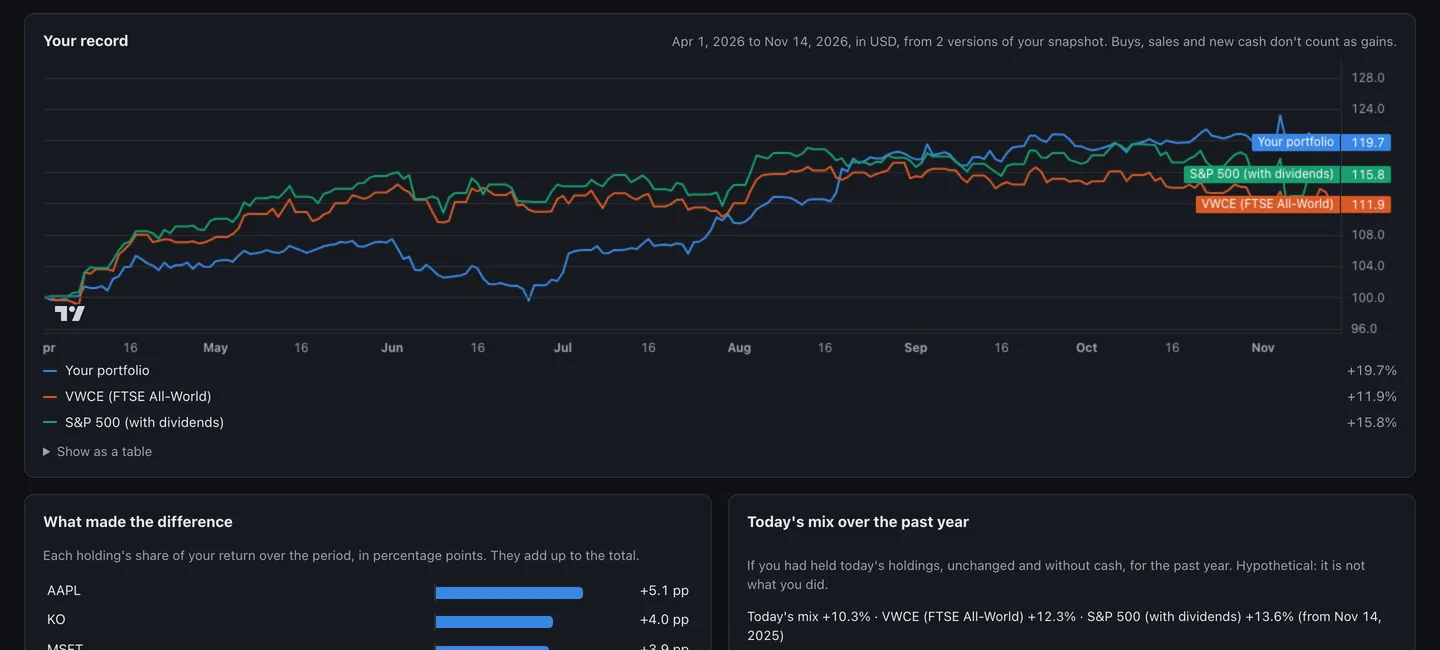
Performance compares your record with two benchmarks, VWCE (FTSE All-World) and the S&P 500 with dividends, in USD or EUR. What made the difference shows each holding's share of the result in percentage points, and Today's mix over the past year is a hypothetical: how today's holdings would have done had you held them all year. The record starts once there is an earlier saved snapshot to compare with.
Heat map
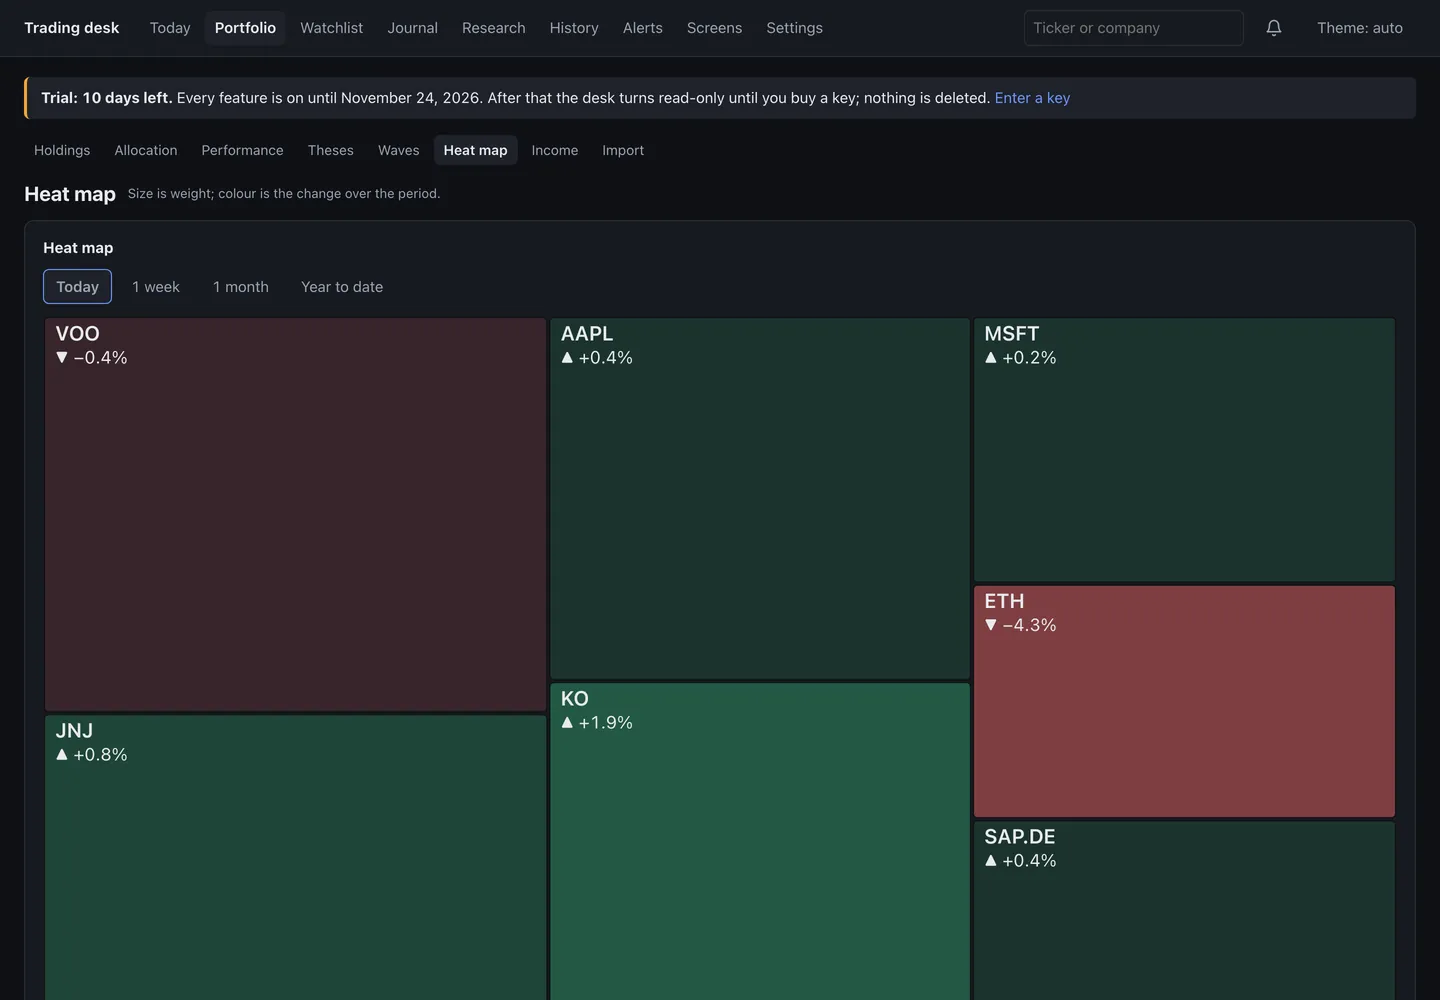
Heat map shows every holding as a tile sized by its weight and coloured by its move: today, over a week, a month or the year to date.
Income
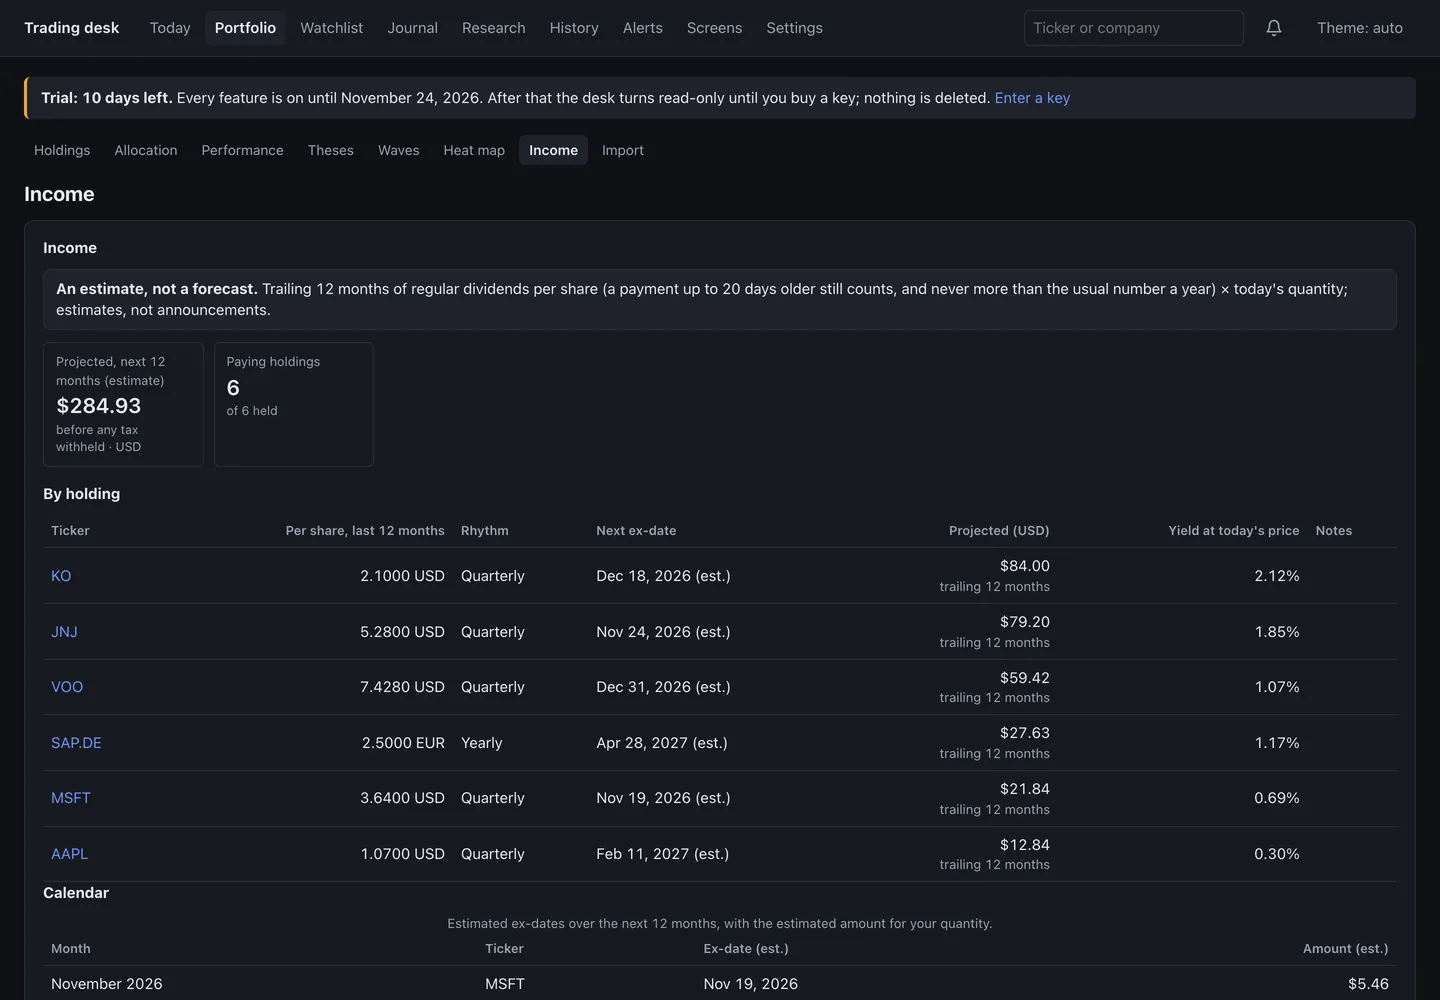
Income projects the next twelve months of dividends from the past twelve, with each holding's rhythm, next ex-date and yield at today's price, and a calendar by month. It is labelled as it is: an estimate, not a forecast, before tax.
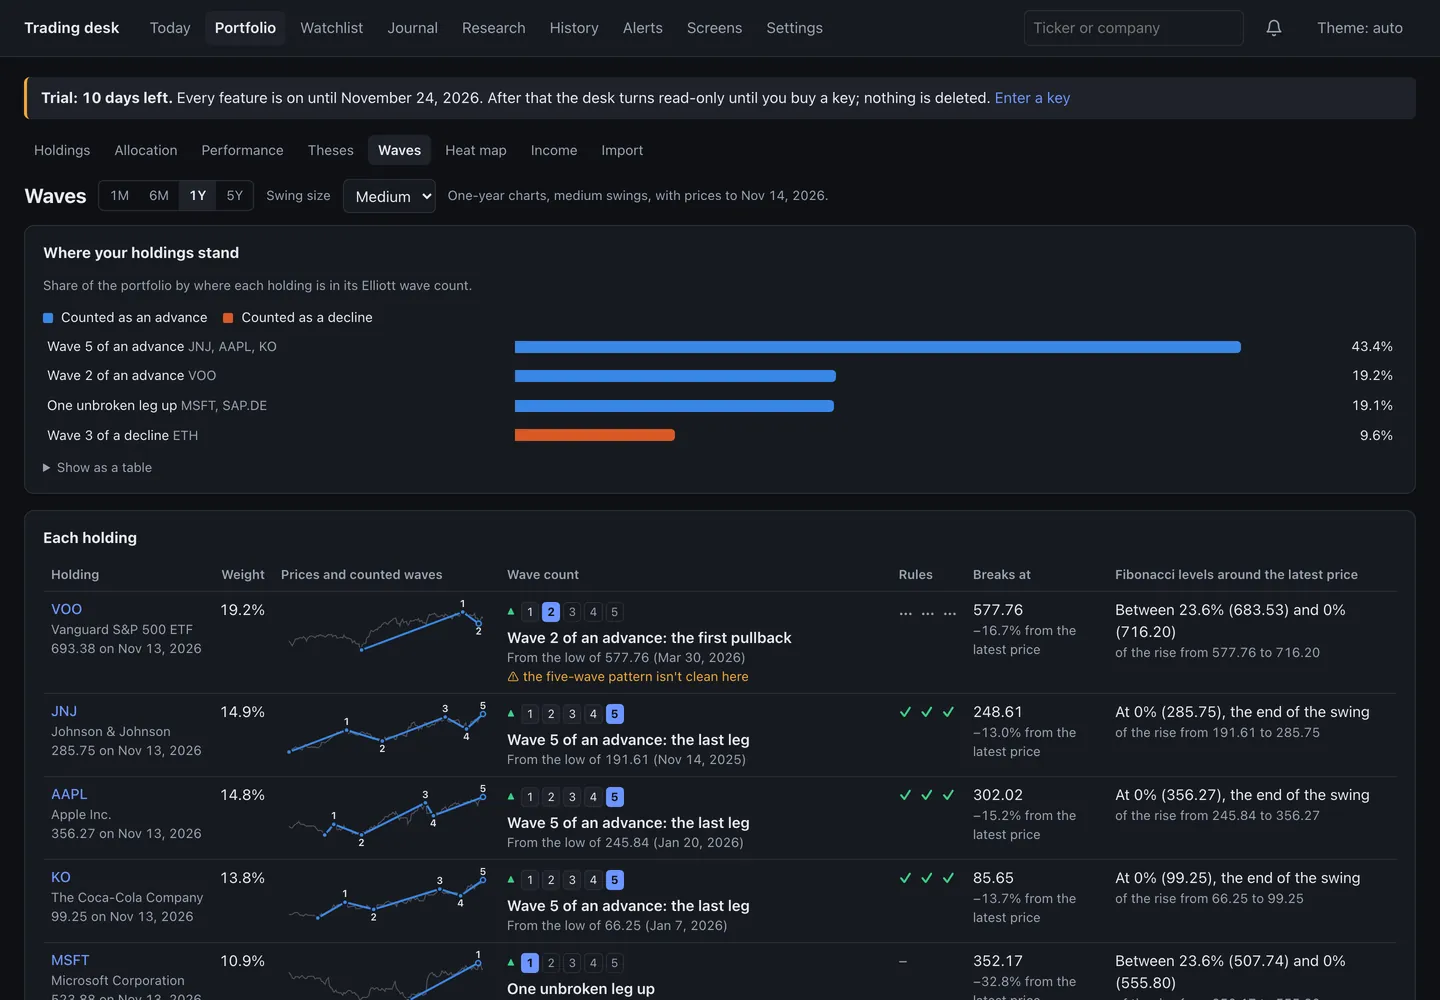
Waves (Pro)
Waves shows every holding's Elliott wave count at once, and how much of the portfolio sits at each stage of a count. It is one mechanical reading of past prices, not a forecast.