
Guide · Charts
Charts, indicators and chart studies
Every control on a ticker's chart, from moving averages and RSI to DCA zones, wave counts and Fibonacci levels, and which licence has them.
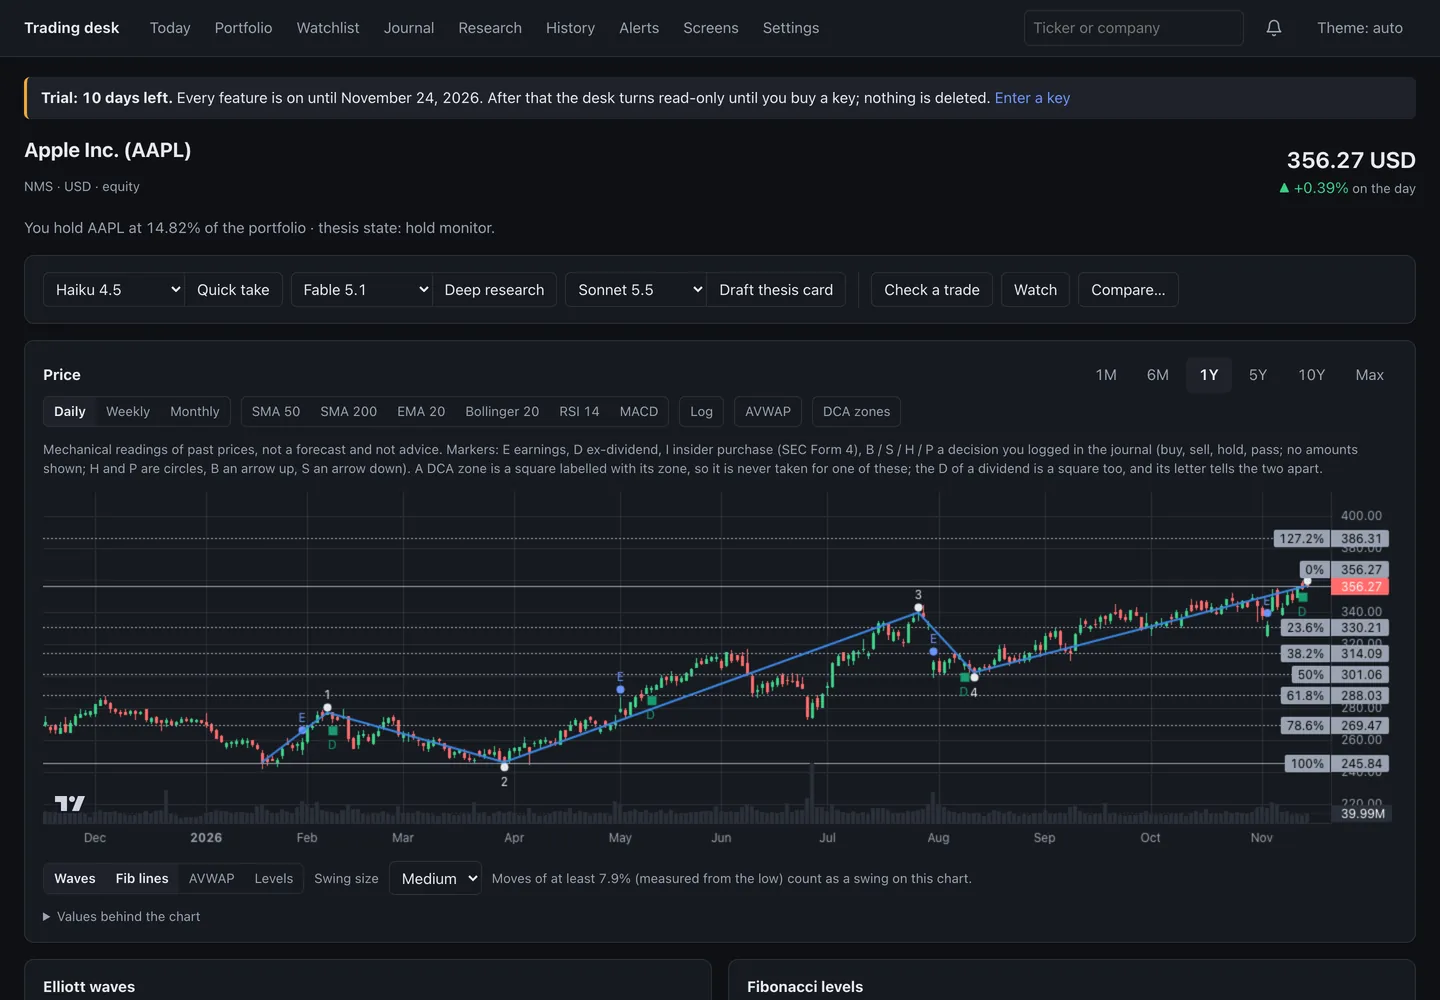
Every ticker has a page with a price chart and a table twin under it. The chart's own note says what everything on it is: "Mechanical readings of past prices, not a forecast and not advice."
The controls
- Range: 1M, 6M, 1Y, 5Y, 10Y, Max.
- Bars: Daily, Weekly or Monthly, and Log for a log scale.
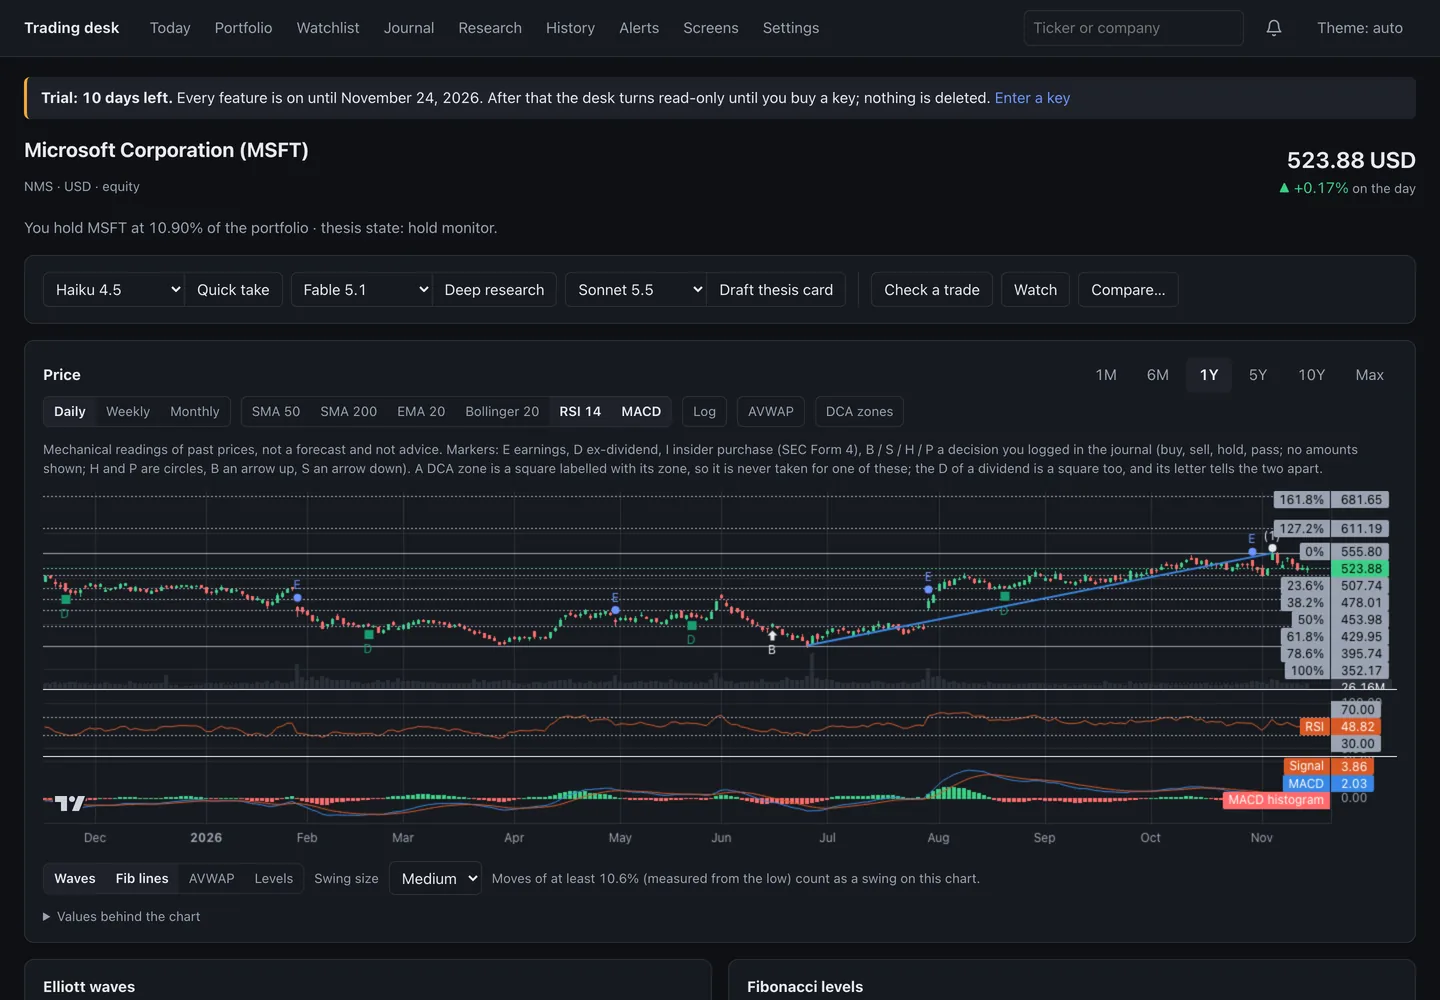
- Indicators: SMA 50, SMA 200, EMA 20, Bollinger 20, RSI 14 and MACD (the last two in their own panes).
- AVWAP: an anchored VWAP from a day you pick on the chart (up to three anchors). Pro.
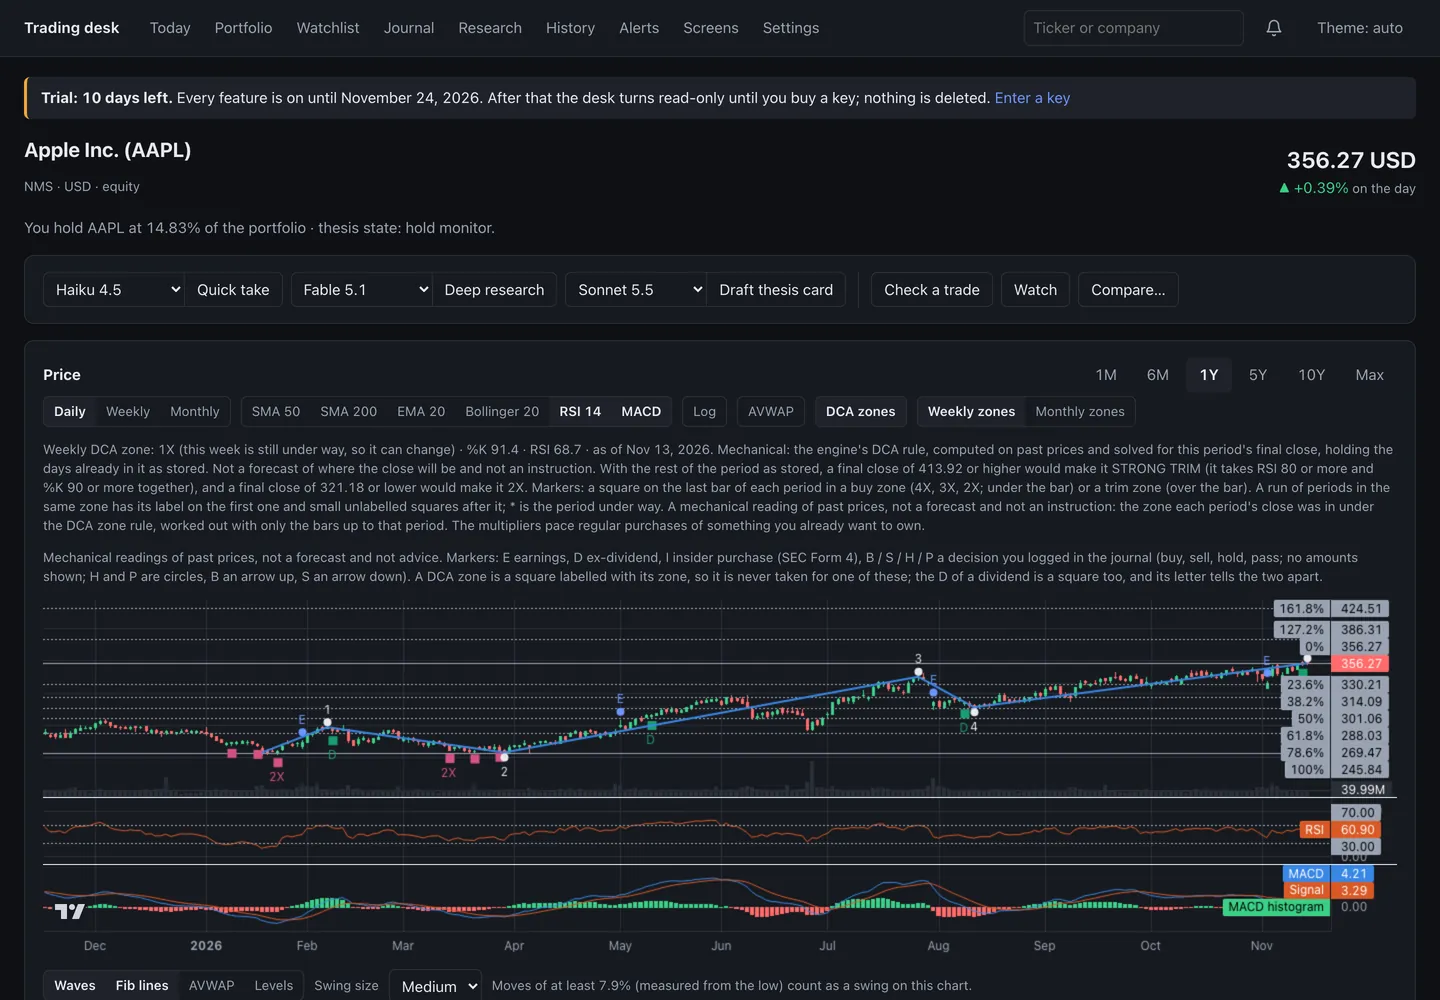
- DCA zones: price zones drawn from past prices, weekly or monthly, labelled from 4X down to LIGHT and STRONG TRIM, with a backtest of how following them would have gone. In the app's words they are a way to pace purchases of something you already want to own, "not a forecast and not advice", and the backtest has no fees, taxes or slippage and is not evidence it will repeat. Pro.
- Under the chart: Waves (an Elliott wave count), Fib lines (Fibonacci levels), Levels (support and resistance found mechanically) and the Swing size they use. Pro.
Markers
Letters on the chart mark events: E earnings, D ex-dividend, I an insider purchase (SEC Form 4), and B / S / H / P a decision you logged in your journal (buy, sell, hold, pass).
On every licence
Ranges, bar intervals, the indicators and the log scale work on every licence. AVWAP, DCA zones, waves, Fibonacci levels and support and resistance are part of Pro (and of the free trial); on Beginner the chart says what was left out.
A wave count or a Fibonacci level is one mechanical reading of past prices. The desk never presents it as a target or a forecast, and the AI is instructed to do the same when it mentions one in a quick take.